
Analytics overview
How Nimriz logs click data, privacy modes, sanitized referrers, unique clicks, and realtime versus reporting.
How Nimriz collects analytics data
Every time a visitor clicks one of your short links, the Nimriz edge captures a privacy-aware click event before issuing the redirect. That event can flow through several layers:
- Realtime hot projection: a bounded event is written immediately to Nimriz's analytics store. This is what Realtime analytics reads.
- Reporting rollups: scheduled sync jobs aggregate analytics events into Postgres rollup tables. Dashboard charts, totals, and breakdowns read from these rollups.
- Touch archive and exports: a privacy-safe touch archive can be stored in object storage for longer-horizon reporting, warehouse loading, and customer-requested exports.

Because of this design:
- Realtime shows events within seconds.
- Dashboard reports update on a schedule and may lag by a few minutes.
- The
clickscount on a link updates on sync cycles, not instantly per click. - Exports and warehouse workflows use the documented privacy-safe data contract, not browser cookie preferences.
Redirect analytics and cookie preferences
Redirect analytics are edge-side service analytics for customer links. They are separate from Nimriz website and dashboard cookie preferences.
Cookie preferences apply to optional browser-side tools on Nimriz surfaces, such as Amplitude product analytics, GTM-loaded tags, HubSpot tracking, and first-party browser storage. They do not turn off redirect analytics for customer links. Redirect analytics follow the organization, workspace, and link privacy settings below.
Customer-configured pixels, conversion APIs, integration destinations, and downstream vendors are customer-controlled choices. You are responsible for the notices, legal basis, consent where required, and vendor review for your campaign context.
Privacy modes
Nimriz does not store original IP addresses or complete User-Agent strings in redirect analytics. Those values may be used transiently at the edge to derive reporting context, classify bots, and compute privacy-aware hashes before the original values are discarded.
Standard privacy (default)
- Nimriz may compute daily-salted pseudonymous hashes of IP address and User-Agent at the edge.
- The salt rotates daily, so the same network/device signal does not produce one long-lived identifier across days.
- These hashes support per-day deduplication and unique-click reporting.
- Standard privacy can include best-effort dimensions such as country, region, city, device category, browser/OS family, referrer host, social source, bot flag, and a sanitized referrer URL in archive-backed workflows.
- Daily-salted hashes are derived identifiers and should be treated as sensitive operational data.
Strict privacy
- Visitor hashes are omitted.
- City, colo, and archive referrer URL are omitted.
- Unique clicks are unavailable because there is no visitor hash to deduplicate.
- Aggregate click counts can remain available.
- Country, region, device/browser/OS family, referrer host, social source, touch type, and bot flag can remain available where supported and where the request supplies them.
- Strict privacy can be set at the organization level, workspace level, or individual link level.
Privacy resolution order
The most restrictive applicable setting always wins:
- Organization policy, which can require strict privacy for every workspace and link.
- Individual link override, which can make a link stricter than the workspace default.
- Workspace default.
Unique clicks and mixed privacy scopes
Unique clicks require the effective privacy mode to be standard for the reporting scope. If any link in the selected scope uses effective strict privacy, the unique click total for that mixed scope shows as unavailable.
This matters for workspace-wide reports:
- A workspace with 100 links on standard privacy and 1 link on strict privacy will show unique clicks as unavailable for the workspace-level total.
- Per-link analytics for standard-privacy links still show their own unique clicks correctly.
Referrers and attribution identifiers
Nimriz keeps referrer_host and social_source as normal reporting dimensions where available. Archive-backed workflows may also keep a sanitized referrer_url in standard privacy.
Sanitized referrer URL means origin plus pathname only. Query string, fragment, username, password, and excessive length are removed. Strict privacy omits archive referrer URL.
Attribution identifiers such as nim_ct, gclid, fbclid, ttclid, and similar external click IDs are purpose-bound campaign identifiers. Treat them like ad click IDs, not general debug data.
Do not place personal data, secrets, access tokens, or sensitive data in destination URLs, short-link paths, UTM fields, custom query parameters, pixel settings, or conversion payloads unless you have an appropriate basis and understand downstream processing.
The seven analytics sub-pages
Your dashboard analytics are organized into seven sub-pages, accessible from Analytics in the sidebar (the same menu also links to the separate Realtime view):
Overview
The default view. Shows total clicks over time, a daily trendline, top-level breakdowns (country, device, referrer, touch type), and click counts per link. Use this for a quick pulse on overall workspace activity.
Acquisition
Focuses on where traffic is coming from. Shows referrer breakdown, social source classification, and UTM campaign/source distribution. Use this to understand which channels and campaigns are driving the most traffic.
Technology
Focuses on how visitors are accessing your links. Shows device category (mobile/tablet/desktop), operating system, and browser distribution. Use this to understand your audience's technology profile and to verify that device-targeted routing rules are reaching the right segments.
Geography
Focuses on where visitors are located. Shows country distribution, with drill-down to region and city where available. Use this to understand geographic reach and to verify geo-targeted routing rules.
QR Performance
Focuses only on QR-origin traffic. Shows QR scans over time, QR share of traffic, and top QR-enabled links without requiring you to rebuild the same filter every time. Growth plans and above can use the dedicated QR Performance page. Professional plans and above also unlock the Live QR heatmap, which appears in the QR-filtered Realtime view.
Pages
Focuses on hosted pages and virtual business cards. Shows page and card views, QR-to-page funnel performance, key actions, leads, RSVPs, top pages, top cards, and supported metadata breakdowns. Use this to compare hosted content without opening each page or card detail view. For one hosted page, use the page's Track tab; for one card, use the card's Engagement tab. Link detail also shows a compact hosted-page summary when the link owns a hosted page.
Conversions
The Conversion reporting view shows conversion events recorded through the Conversion API, attributed back to specific clicks. It includes KPI counts by outcome (attributed outcomes, sales, leads, negative outcomes), a daily conversion-events chart, an attribution-method split, and a table of attributed conversions carrying click-time UTM, variant, and experiment context. You can filter by domain, short URL, and event type. The view requires a plan that includes conversion reporting and conversion tracking enabled for your workspace.
The QR trigger filter
The Overview, Acquisition, Technology, Geography, and QR Performance views include a Trigger filter that lets you separate QR code scans from standard short URL clicks. The filter is a multi-select over all recorded event types-alongside Short URL and QR you can also isolate hosted-page and virtual-card events.
| Selection | What it shows |
|---|---|
| All triggers | Total traffic (all event types combined). |
| Short URL | Only standard link clicks. |
| QR | Only clicks originating from QR code scans. |
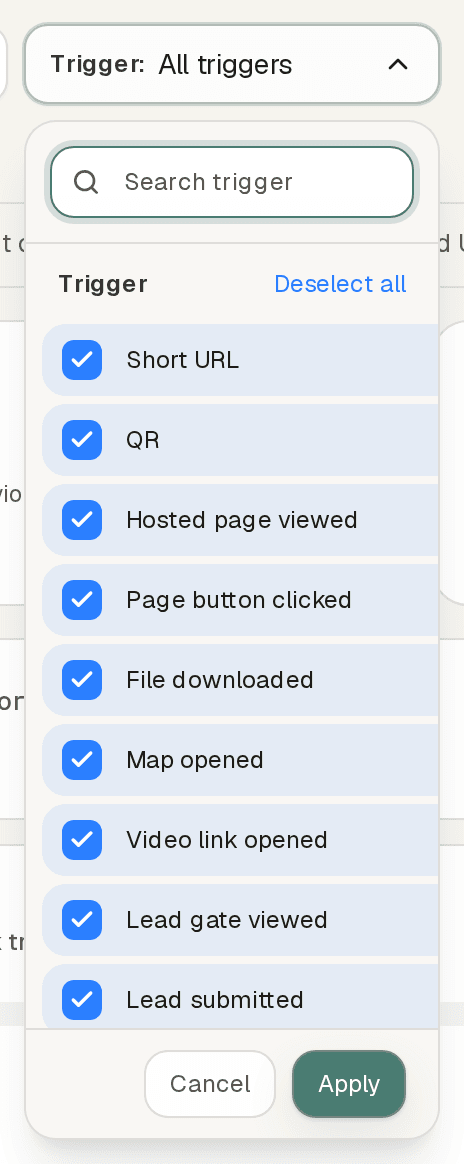
The trigger filter applies to all charts and breakdowns in the active view. Use it to understand the split between your QR and direct-link audiences. (The Realtime view offers the equivalent Event filter; the Pages and Conversions views use their own filter sets.)
Humans only filter
Overview, Acquisition, Technology, Geography, and QR Performance also include a Humans only checkbox in the shared filter bar. When unchecked (the default), charts and tables include both human and bot traffic. When checked, bot-flagged clicks are excluded from the primary metrics while bot counts remain visible in tooltips and dedicated bot columns where shown.
QR scans are identified by the ?nr=qr parameter Nimriz embeds in every generated QR code. This parameter is stripped before the visitor reaches your destination URL.
Analytics for A/B experiments
When a link has an active A/B experiment, click analytics are attributed to stable variant keys. In the link's detail analytics:
- Clicks are broken down by variant key alongside the current variant label.
- Renaming a variant label does not change historical attribution-historical clicks remain under the original key.
- Rows in the Conversions sub-page carry the attributed variant and experiment identifiers, so you can see not just which variant got more clicks, but which variant led to more conversions.
Nimriz does not calculate statistical significance. All experiment decisions are made based on the raw click and conversion counts you observe.
Realtime vs. reporting rollups
Realtime gives you a live event stream updated within seconds of each click. It is best for verifying that a campaign is working, debugging a specific redirect, or confirming that analytics are being logged. It only shows recent events and does not support date-range queries.
Reporting rollups are what the dashboard charts, totals, and breakdowns are built on. They are aggregated from the bounded analytics hot projection on a schedule, so they may lag a few minutes behind real traffic. They support date ranges up to 365 days and are the right source for campaign analysis, exports, and trends.
If you see clicks in Realtime but the dashboard total has not updated yet, wait a few minutes for the next sync cycle to complete.
See Realtime analytics for the full Realtime guide.
Analytics dimensions
| Dimension | Description | Availability |
|---|---|---|
country, region, city | Geo location from Cloudflare's edge data. | Best-effort; may be null. city is omitted in strict privacy. |
device_category | mobile, tablet, desktop. | Derived from User-Agent. |
browser_family | Browser name. | Best-effort. |
os_family | OS name. | Best-effort. |
referrer_host | Referring domain. | Often blank (privacy). |
social_source | Derived social platform classification. | When detectable. |
referrer_url | Sanitized referrer URL for archive-backed workflows. | Standard privacy only; not shown in normal breakdowns. |
touch_type | Stored analytics event key. Reporting surfaces normalize hosted-page and card engagement into canonical event labels such as Hosted Page Viewed, Lead Submitted, and Contact Saved. | Always present. |
bot_flag | true for automated/bot traffic. | Always present. |
variant_key | A/B variant identifier (for routed links). | When routing is active. |
ip_hash, user_agent_hash | Daily-salted pseudonymous hashes used for dedupe and selected internal workflows. | Standard privacy only. Visitor hashes are omitted in strict privacy. |
| Hosted-page metadata | Bounded fields such as block_id, block_type, file_id, provider, target_host, and cta_kind. | Available in supported drilldowns for hosted-page and card engagement events. |
All dimensions are best-effort. Build downstream systems to handle null and missing values gracefully.
API access
The endpoints below are internal control-plane endpoints that power the dashboard's Realtime and breakdown views. They are documented here for response-shape reference; they are not part of the workspace-API-key customer API.
GET /api/live-view
Returns recent click events for the Realtime view and for debugging.
{
  "source": "analytics_engine",
  "count": 1,
  "events": [
    {
      "clicked_at": "2026-04-01T12:34:56.000Z",
      "url_id": "22222222-2222-2222-2222-222222222222",
      "short_code": "spring-launch",
      "country": "US",
      "device_category": "mobile",
      "touch_type": "qr_scan",
      "bot_flag": false,
      "referrer_host": "instagram.com"
    }
  ]
}
GET /api/link-breakdowns
Returns top-N dimension breakdowns for a link over a date range.
Parameters: url_id (required), range_days (default 30, max 365), include_bots (default false), limit (default 5, max 20).
For focused drilldowns, GET /api/link-breakdown-dimension accepts standard dimensions plus hosted-page engagement metadata dimensions: block_id, block_type, file_id, file_role, provider, target_host, cta_kind, contact_action, and method_kind. The optional touch_type filter accepts canonical event keys and supported legacy aliases.
{
  "ok": true,
  "source": "analytics_engine",
  "url_id": "22222222-2222-2222-2222-222222222222",
  "range_days": 30,
  "sampled_counts": true,
  "dimensions": {
    "country": [{ "label": "US", "clicks": 120 }],
    "touch_type": [
      { "label": "Short URL", "clicks": 95 },
      { "label": "QR", "clicks": 25 }
    ]
  }
}
sampled_counts: true means click counts are statistical estimates, not exact totals. Very high-traffic links may show rounded values.
Troubleshooting
My dashboard shows no clicks even though links redirect correctly
- Open the Realtime analytics view to confirm events are being captured.
- If Realtime shows events but reports do not, wait for the next sync cycle (a few minutes).
- If Realtime also shows nothing, confirm the link is on the correct domain (host matching is strict).
Unique clicks are unavailable
Your workspace, a specific link, or your organization has strict privacy active. Check the Analytics governance panel under SettingsWorkspace for your workspace privacy setting, and check with your Org Admin whether an org-wide policy is enforced.
My analytics numbers differ from another tool
- Nimriz counts redirect events at the edge. Other tools (Google Analytics, Plausible) count page-view events on your website. Not every redirect becomes a page view.
- Bot filtering definitions differ between platforms.
- Referrer data is often lost between the redirect and your landing page.
- Report rollups in Nimriz have a slight lag. Use exports for precise reconciliation.
Traffic looks entirely like bots
Links shared in messaging apps (Slack, iMessage, WhatsApp) generate significant preview-bot traffic immediately after sharing. Filter to human-only traffic in the dashboard to see genuine engagement.
Related guides
Related next steps
Ready to test this setup?
Create an account to try the workflow, or compare plans when the setup needs higher limits, integrations, or team controls.